01
Connect
Bring trackers, sensors, and gateways into one reliable receiving layer.
HTTP · TCP · MQTT · LoRaWAN
Connect trackers, sensors, and gateways, and watch every signal become a clear, live picture your team can act on.
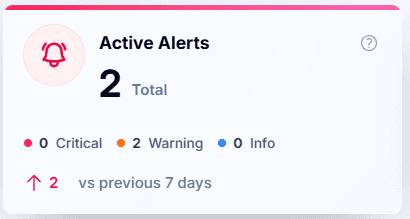
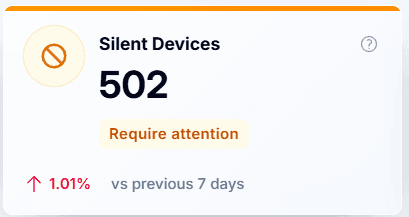
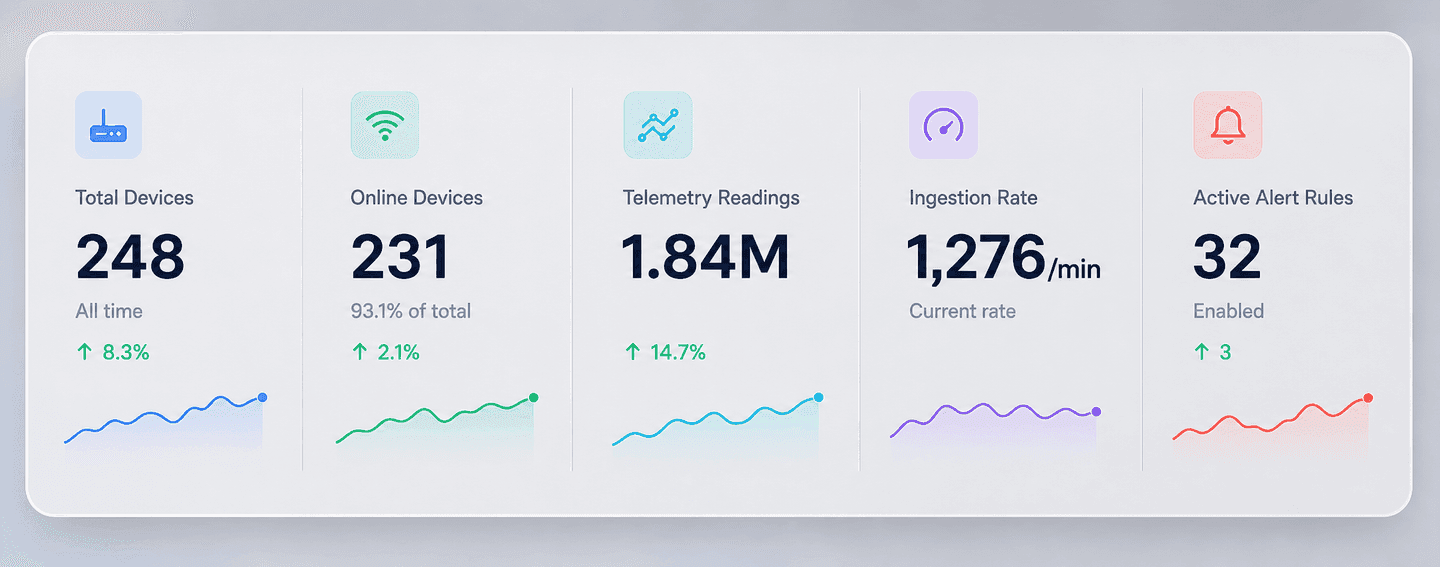
A focused operating picture—from active alerts and silent devices to the speed of your response.
Devices, telemetry volume, ingestion rate, and active rules—the context behind every alert.
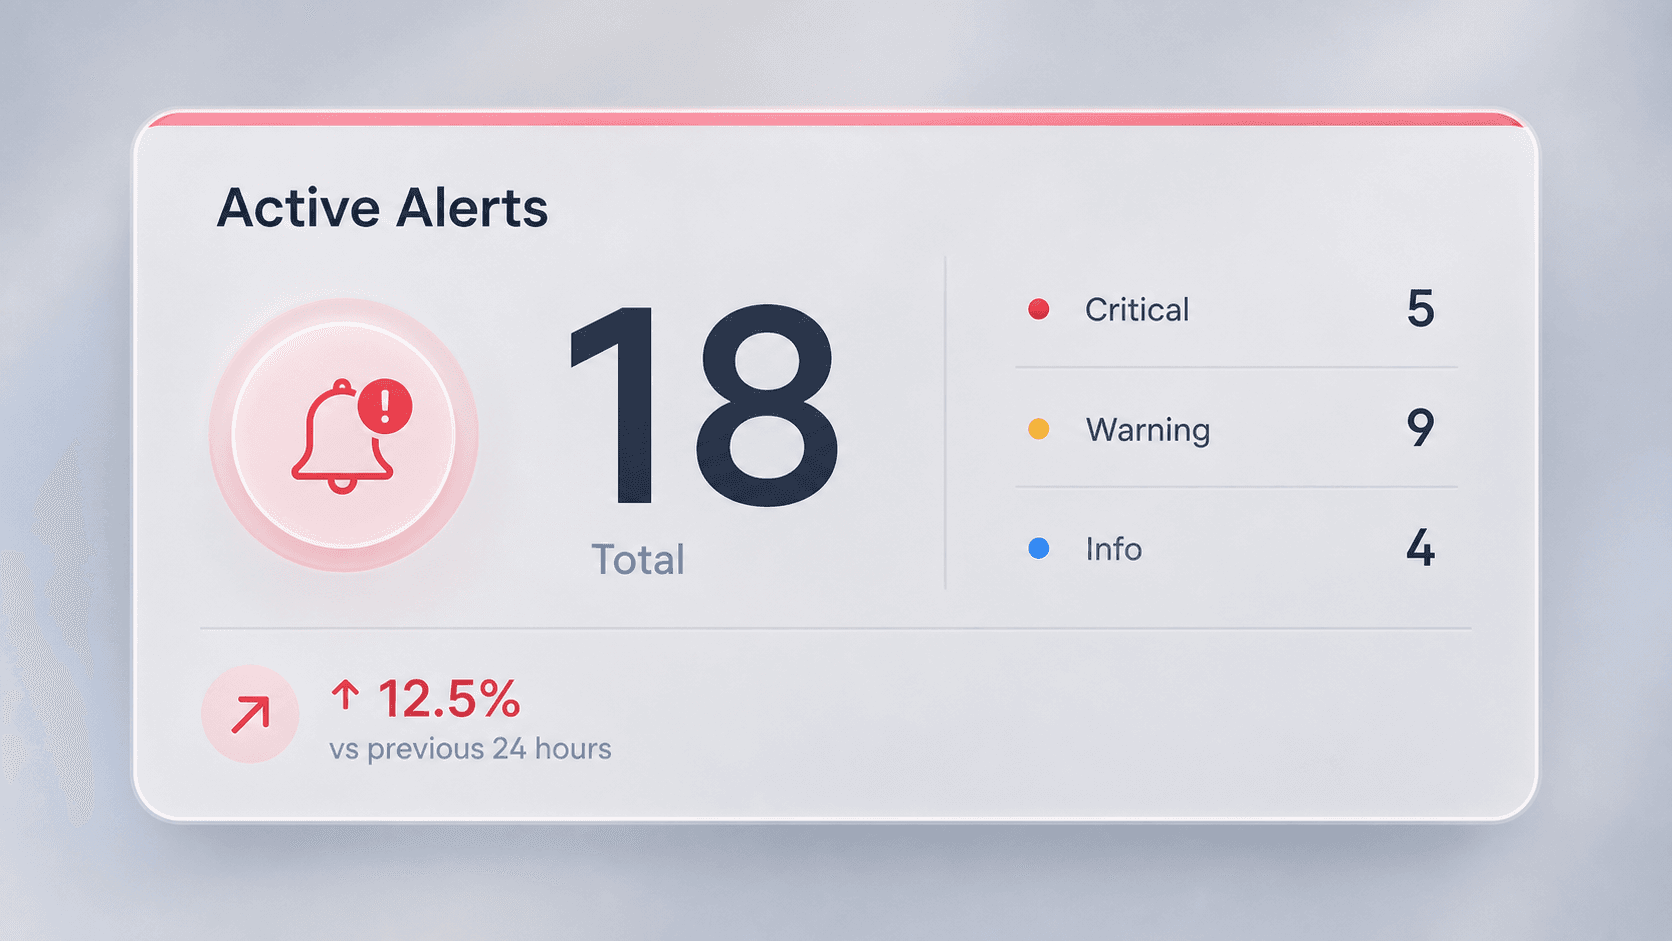
See the total workload, severity mix, and change over the last 24 hours at a glance.
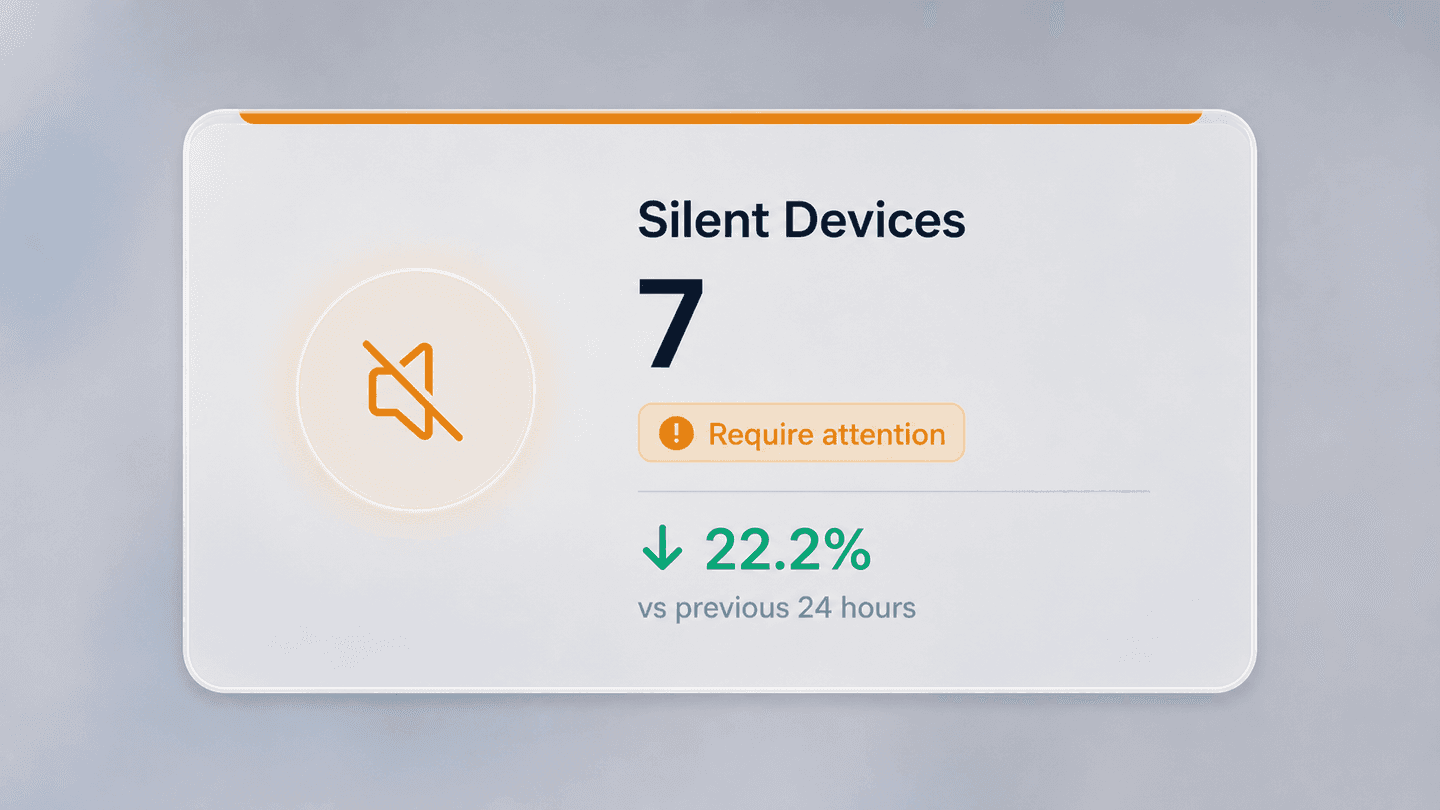
Surface devices that stopped reporting before missing data becomes an operational blind spot.
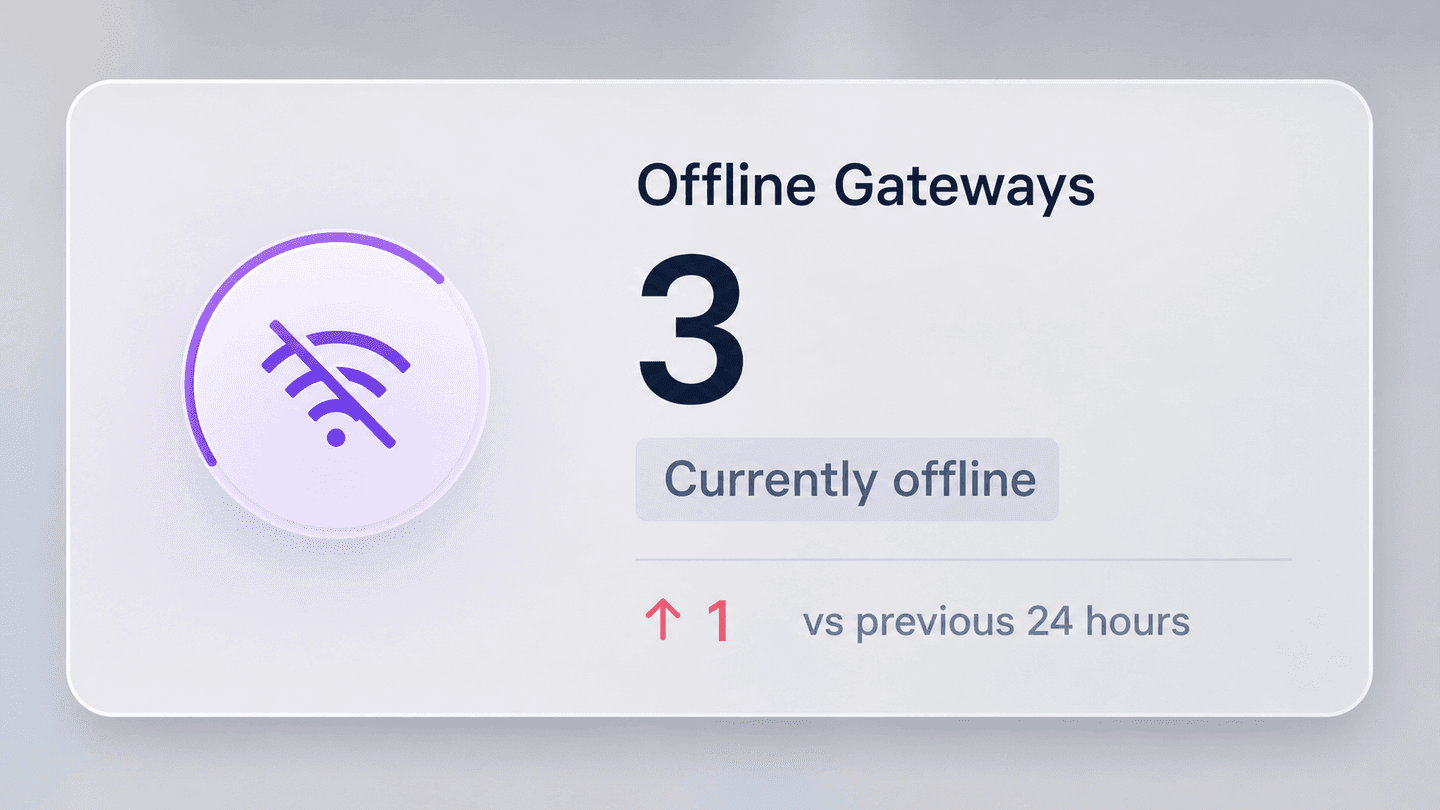
Separate gateway availability from device issues and direct attention to the right layer.
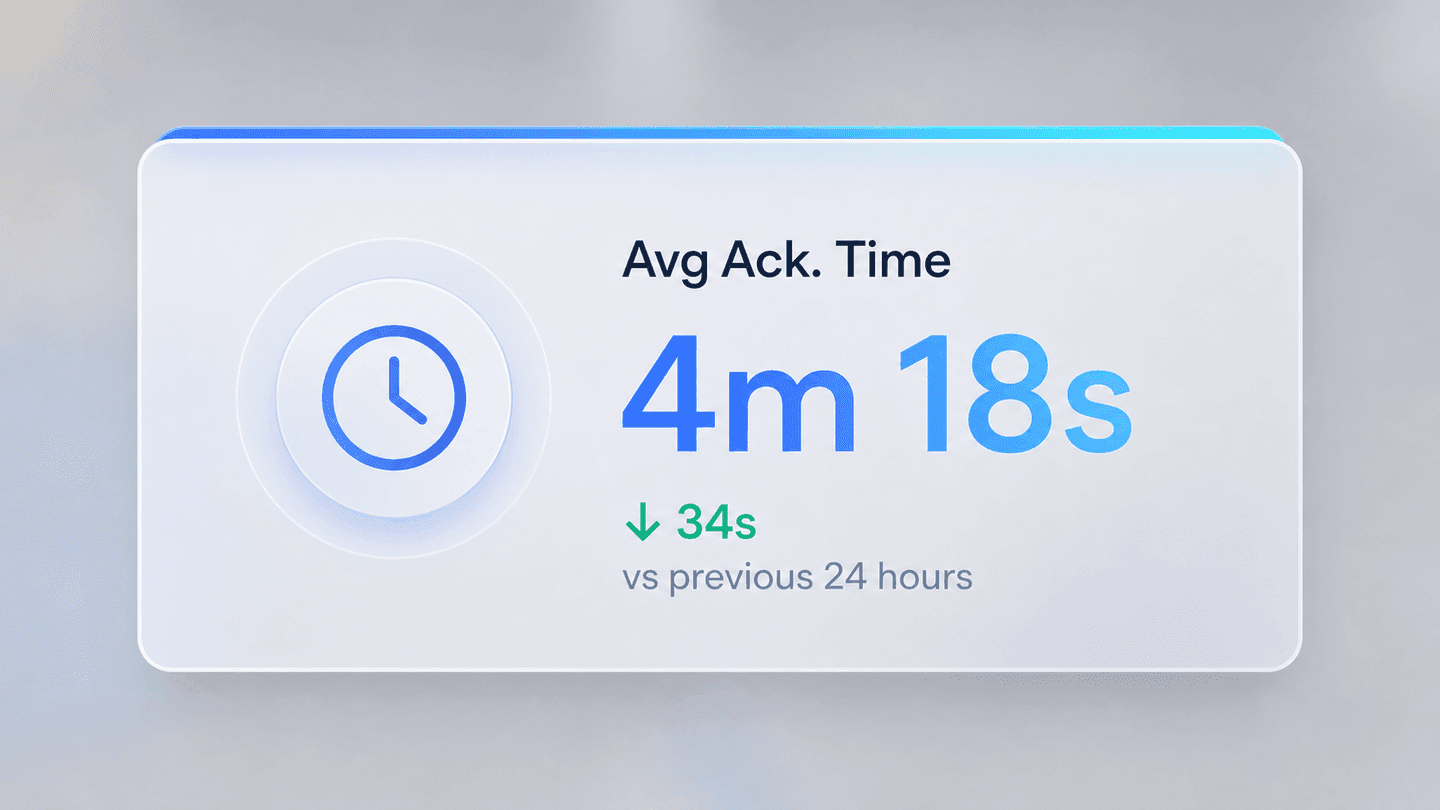
Track how quickly new incidents are seen so response workflows keep improving.
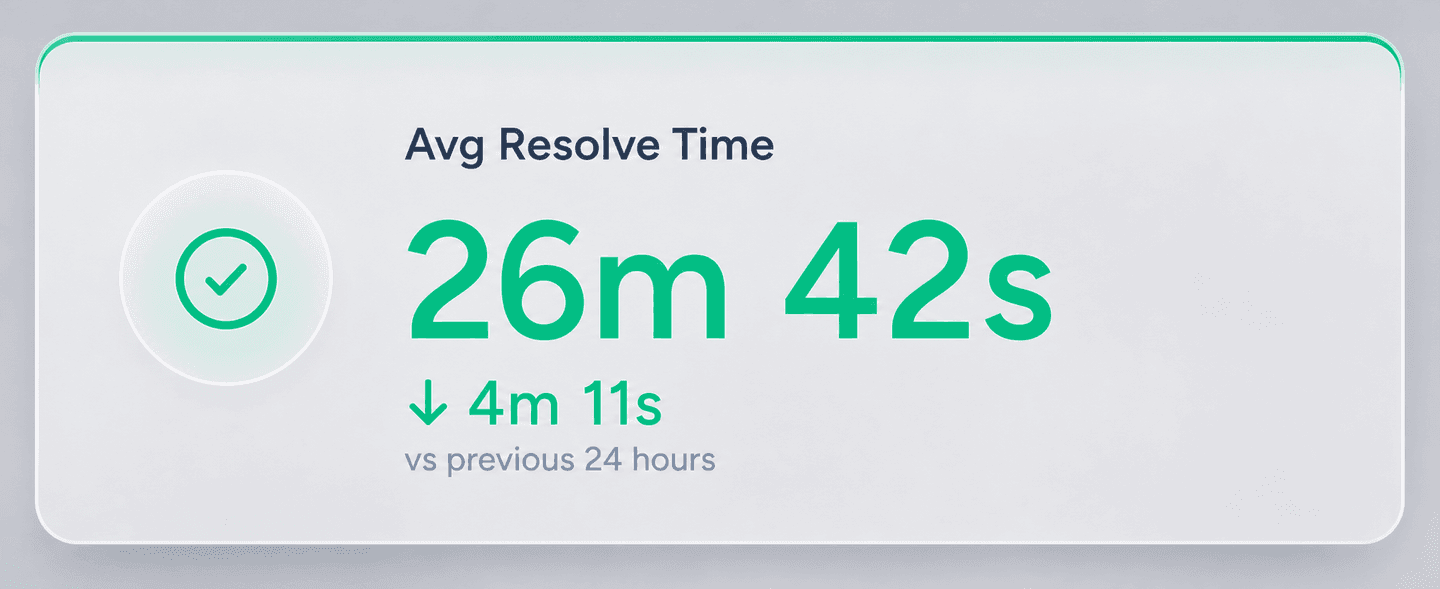
See the full journey from detection to resolution, with clear trends.
Teletra keeps every stage connected, so context is preserved from the moment data arrives to the moment your team responds.
Bring trackers, sensors, and gateways into one reliable receiving layer.
HTTP · TCP · MQTT · LoRaWANDecode, calibrate, and normalize every signal into consistent metrics.
Raw payload → useful readingFollow live health, history, location, and changes from one workspace.
Current state + full contextTurn important conditions into focused alerts with a clear next step.
Rule matched → team informedData keeps moving through the same operational flow—even when no one is watching a dashboard.
Trends, volume, severity, status, and noisy devices come together in a dashboard built for fast, confident decisions.
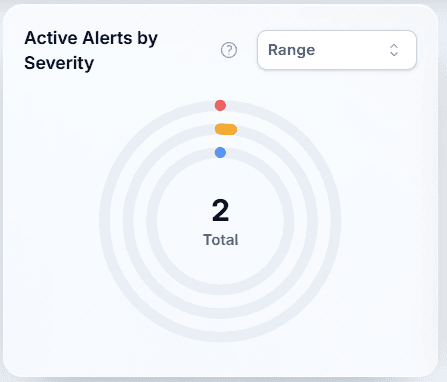
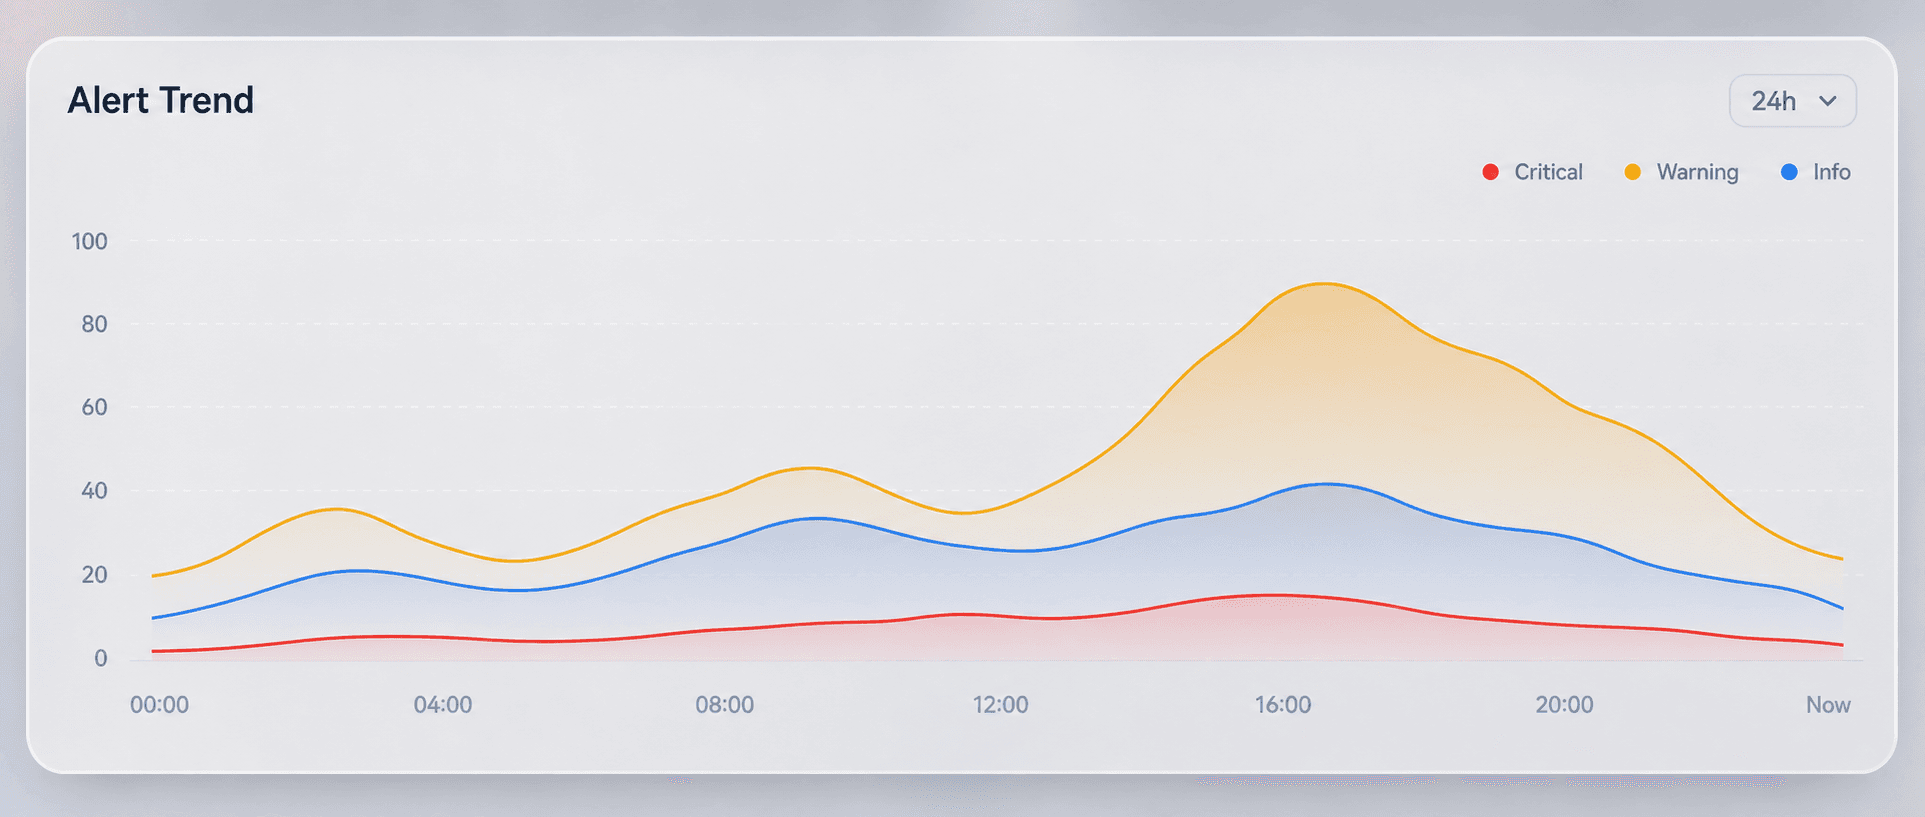
Compare critical, warning, and informational events across the day to spot recurring peaks.
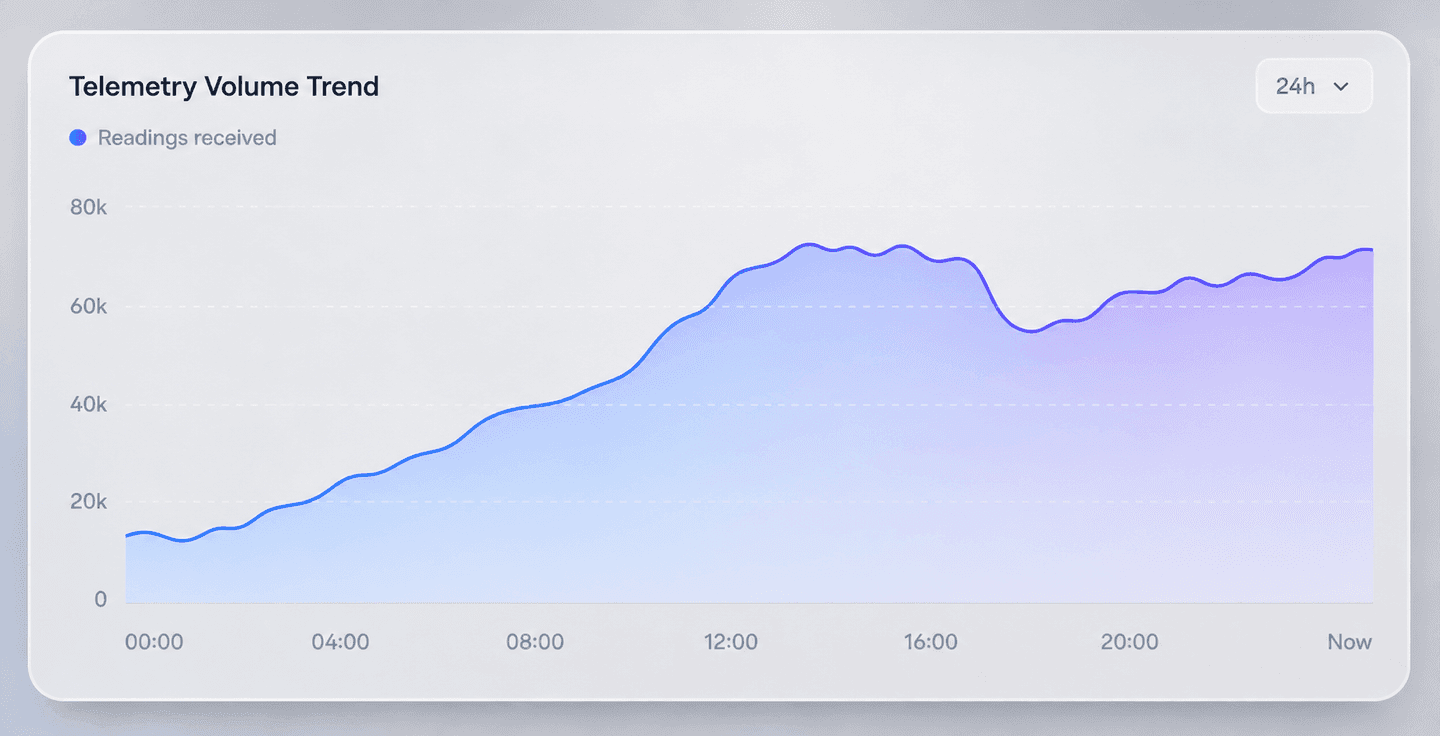
Understand how many readings reach the platform and immediately notice a change in volume.
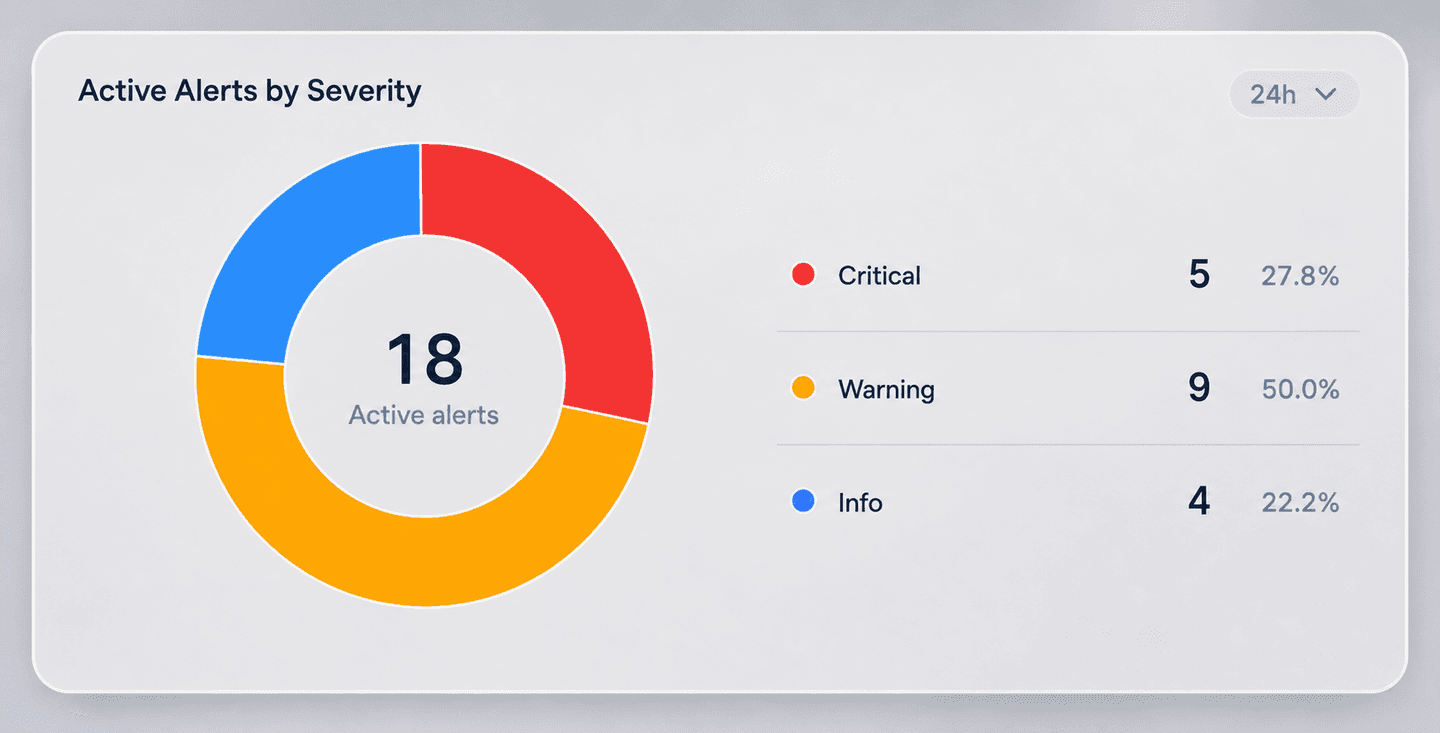
A clear severity breakdown keeps critical events visible without losing the wider context.
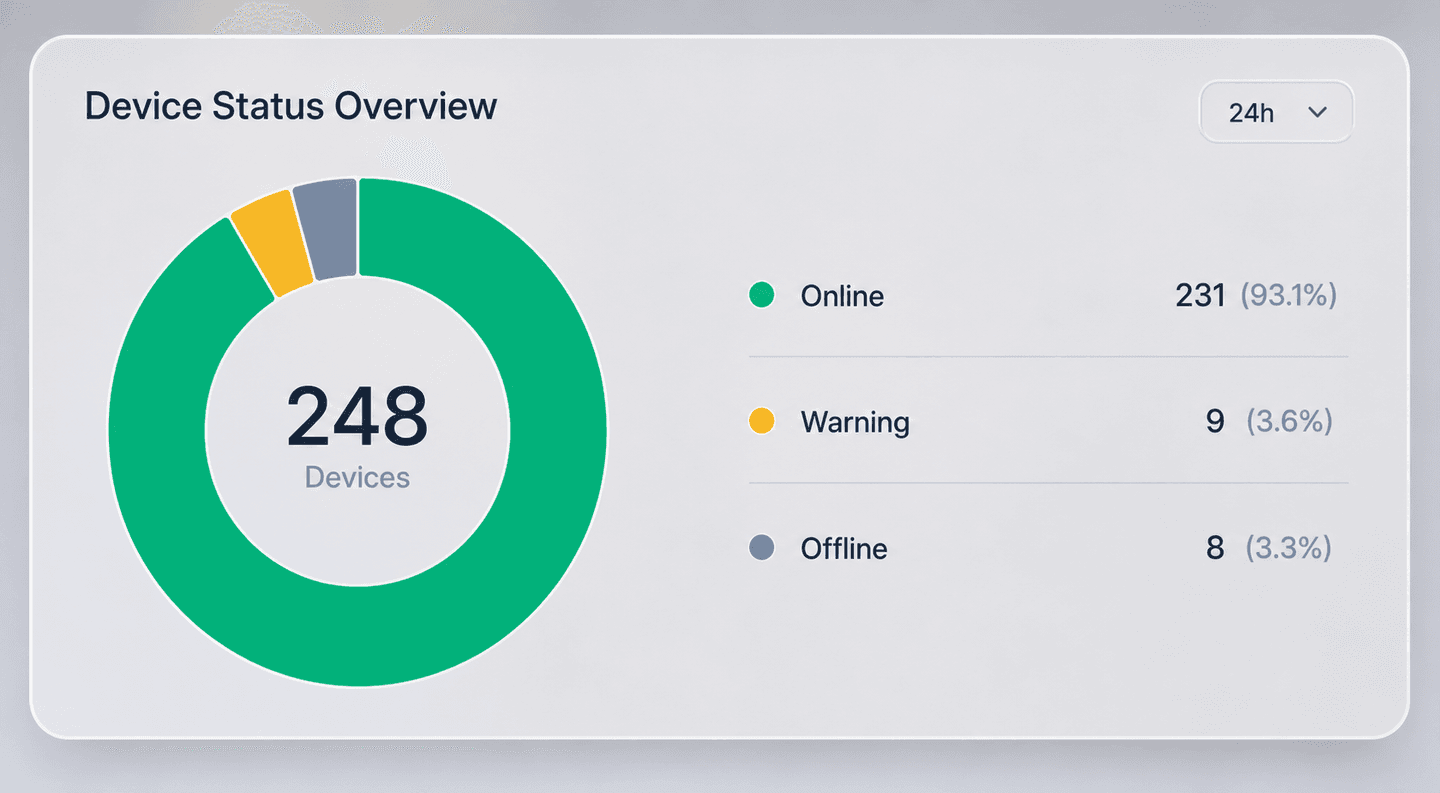
See what is online, warning, or offline across the complete connected estate.
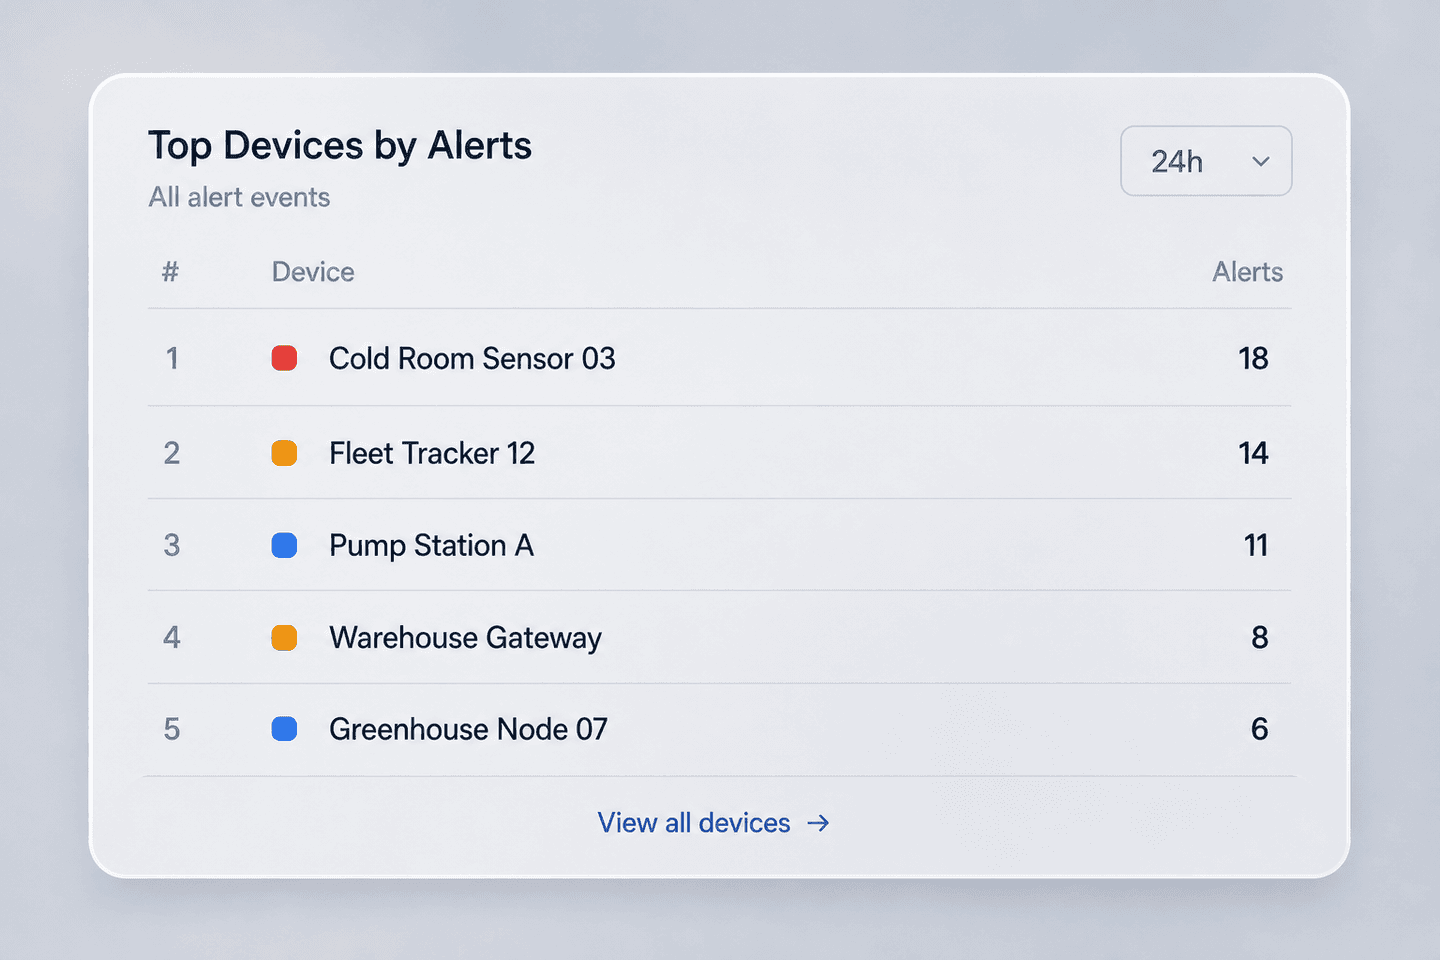
Rank devices by alert activity so teams can investigate the biggest sources first.
Move from a fleet-wide signal to the exact device, then understand its reporting health, message activity, and individual metrics.
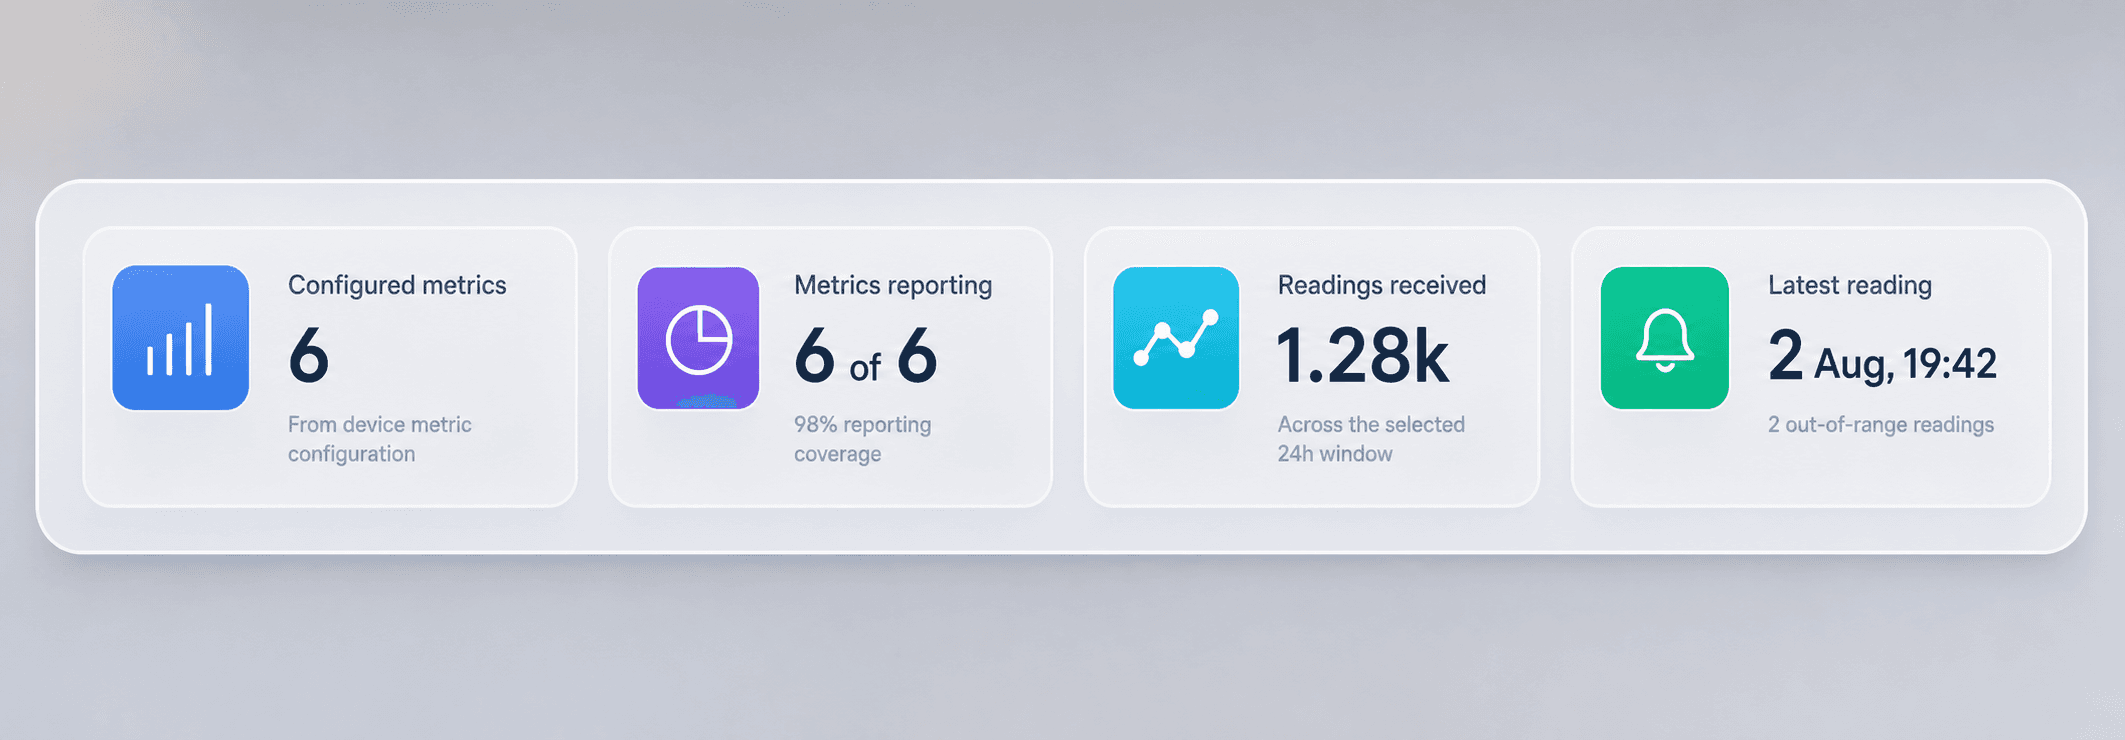
Configured metrics, reporting coverage, received readings, and the latest activity provide a fast first diagnosis.
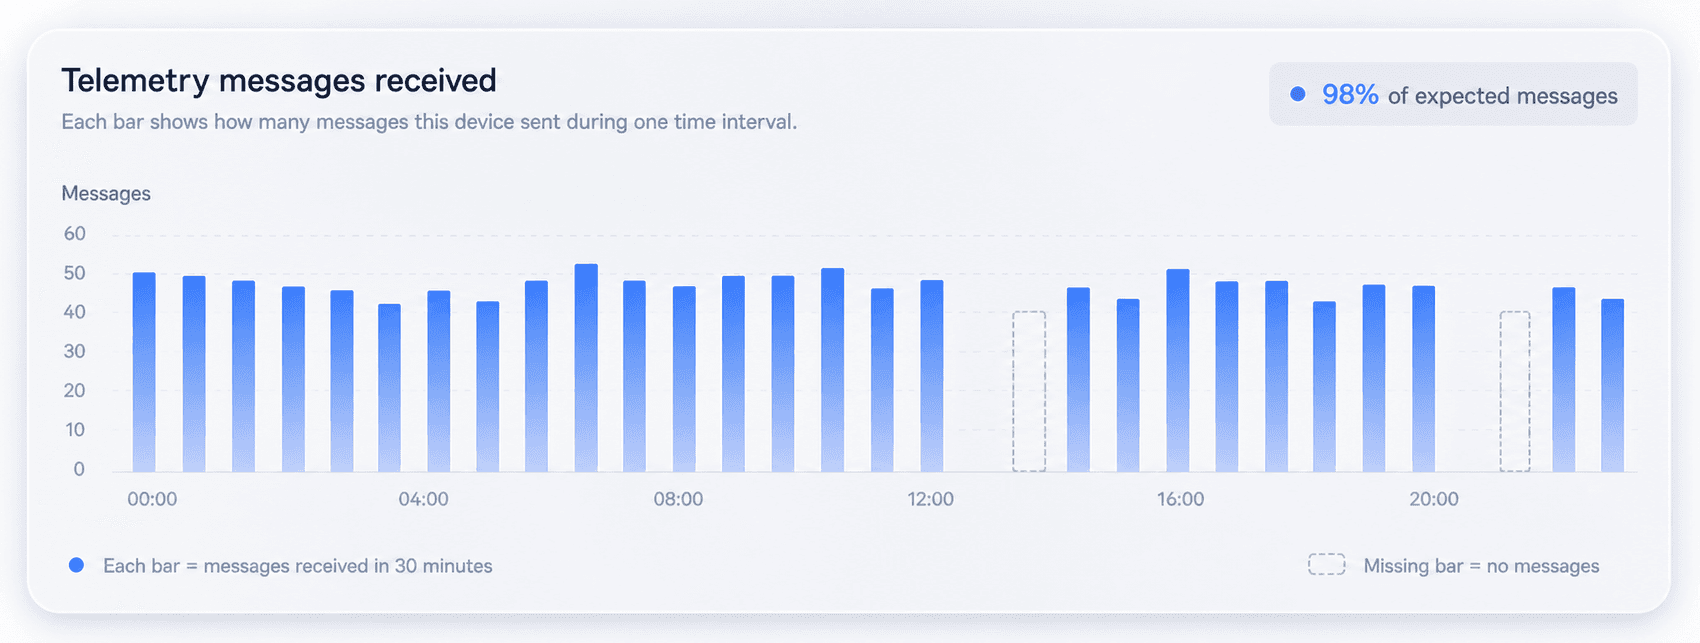
Expected delivery is visualized interval by interval, making missing messages easy to identify.
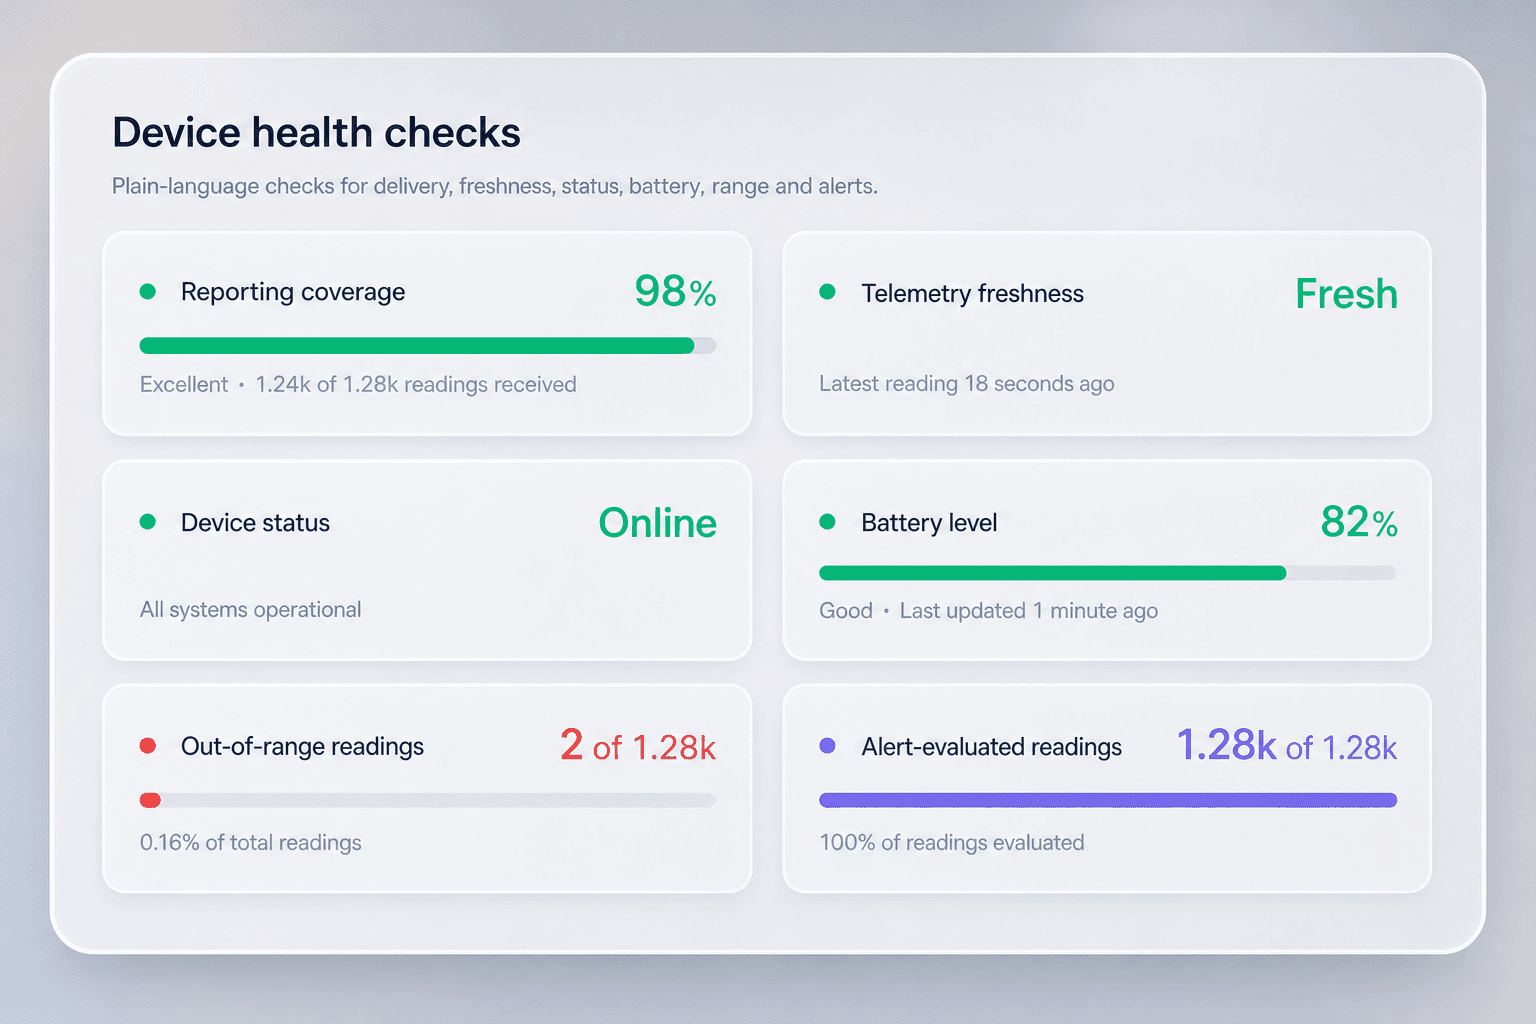
Coverage, freshness, connection, battery, range, and alert evaluation are checked in one readable view.
Teletra keeps calibrated numeric readings and simple state changes equally clear.
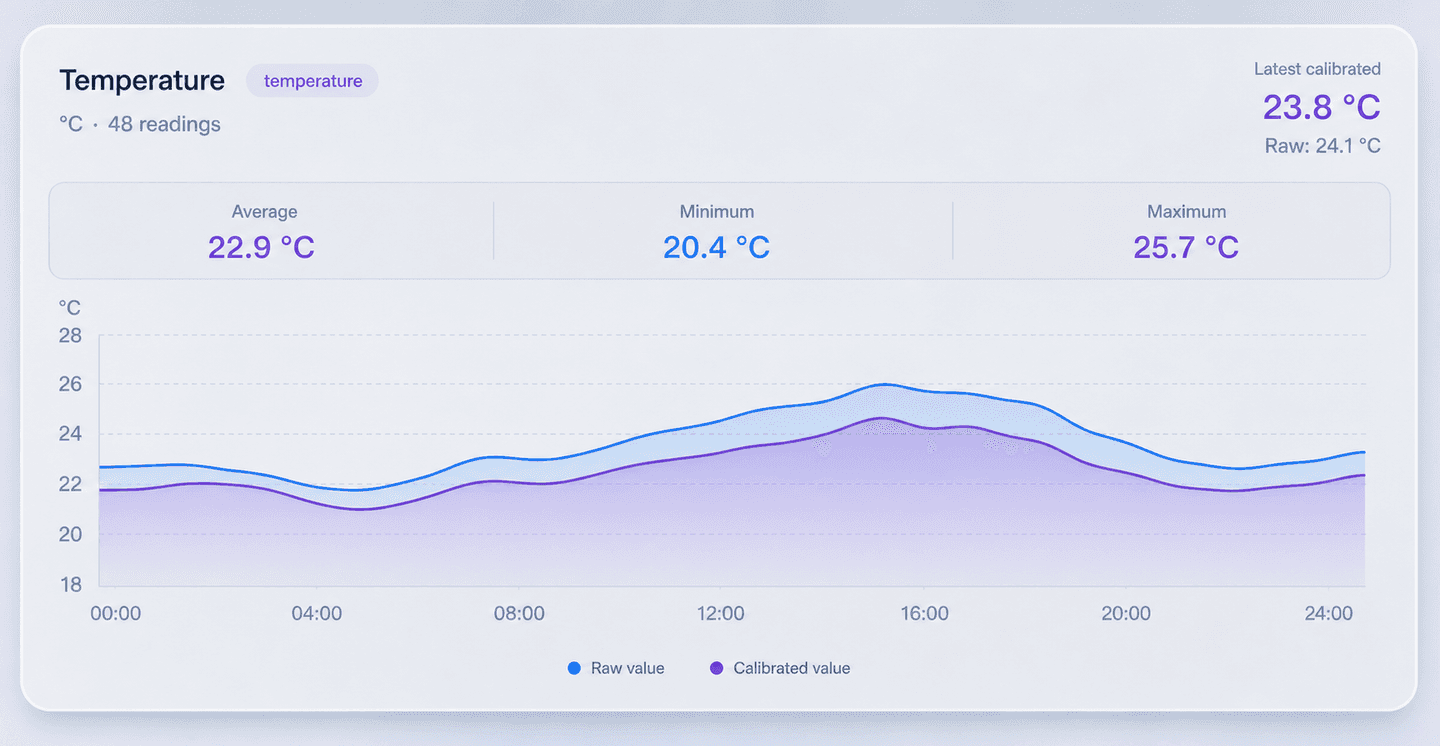
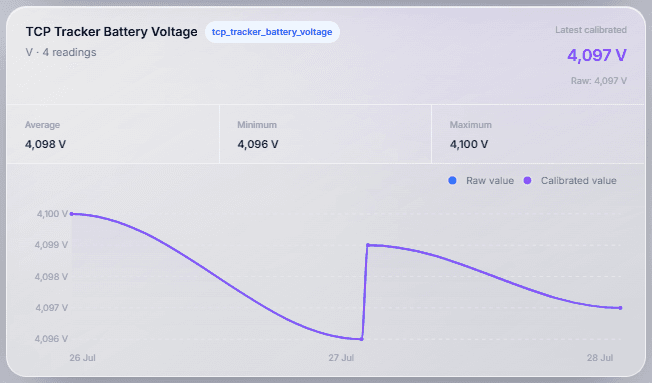
Compare raw and calibrated values with averages and operating range.
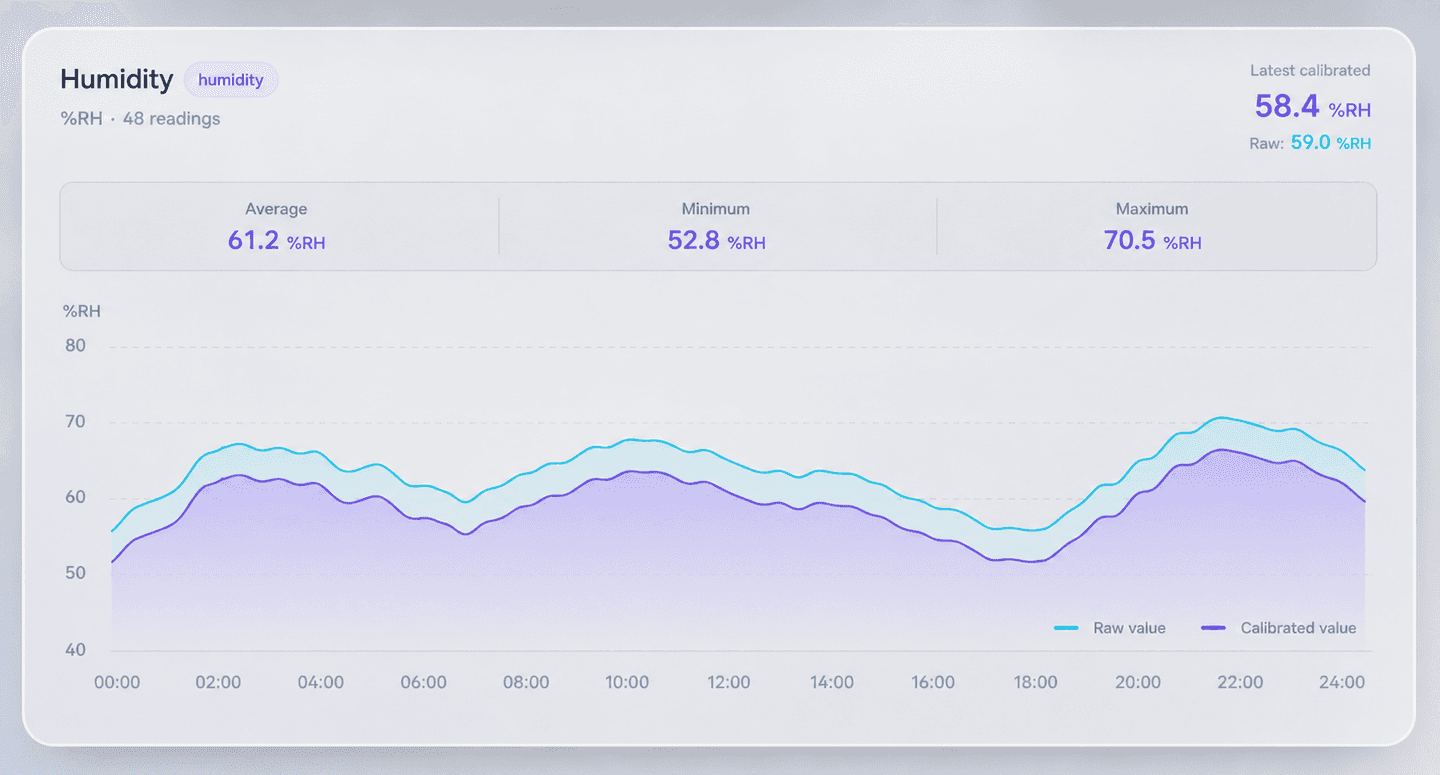
Read current conditions alongside the complete daily trend.
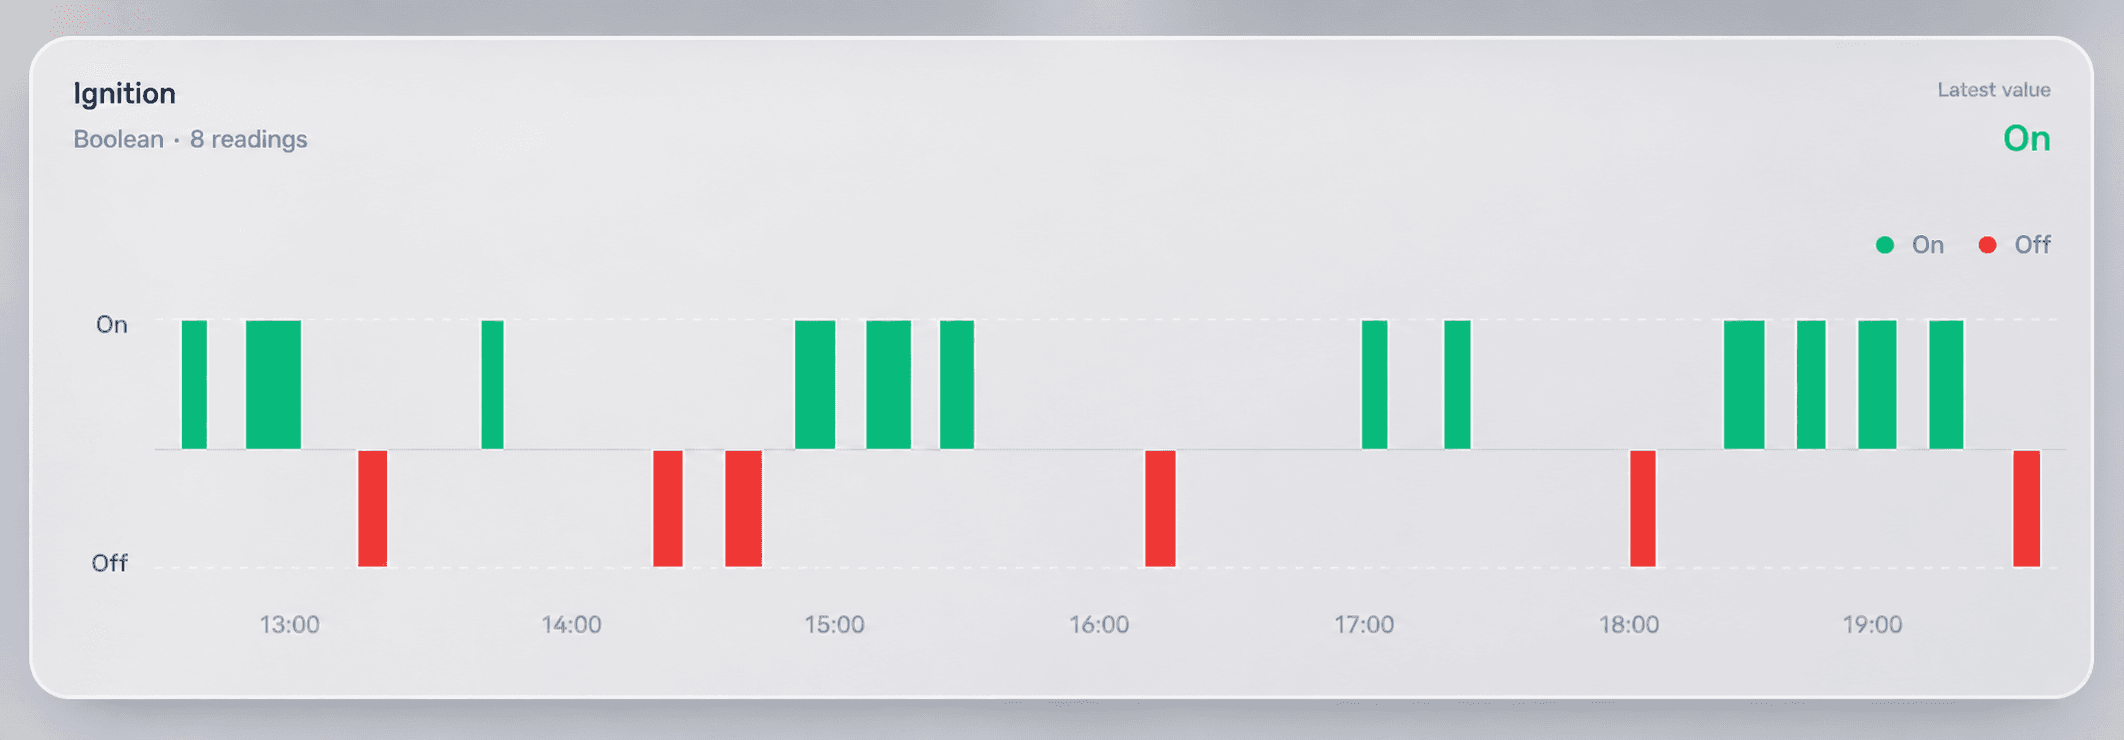
Make on/off state changes as easy to investigate as numeric telemetry.
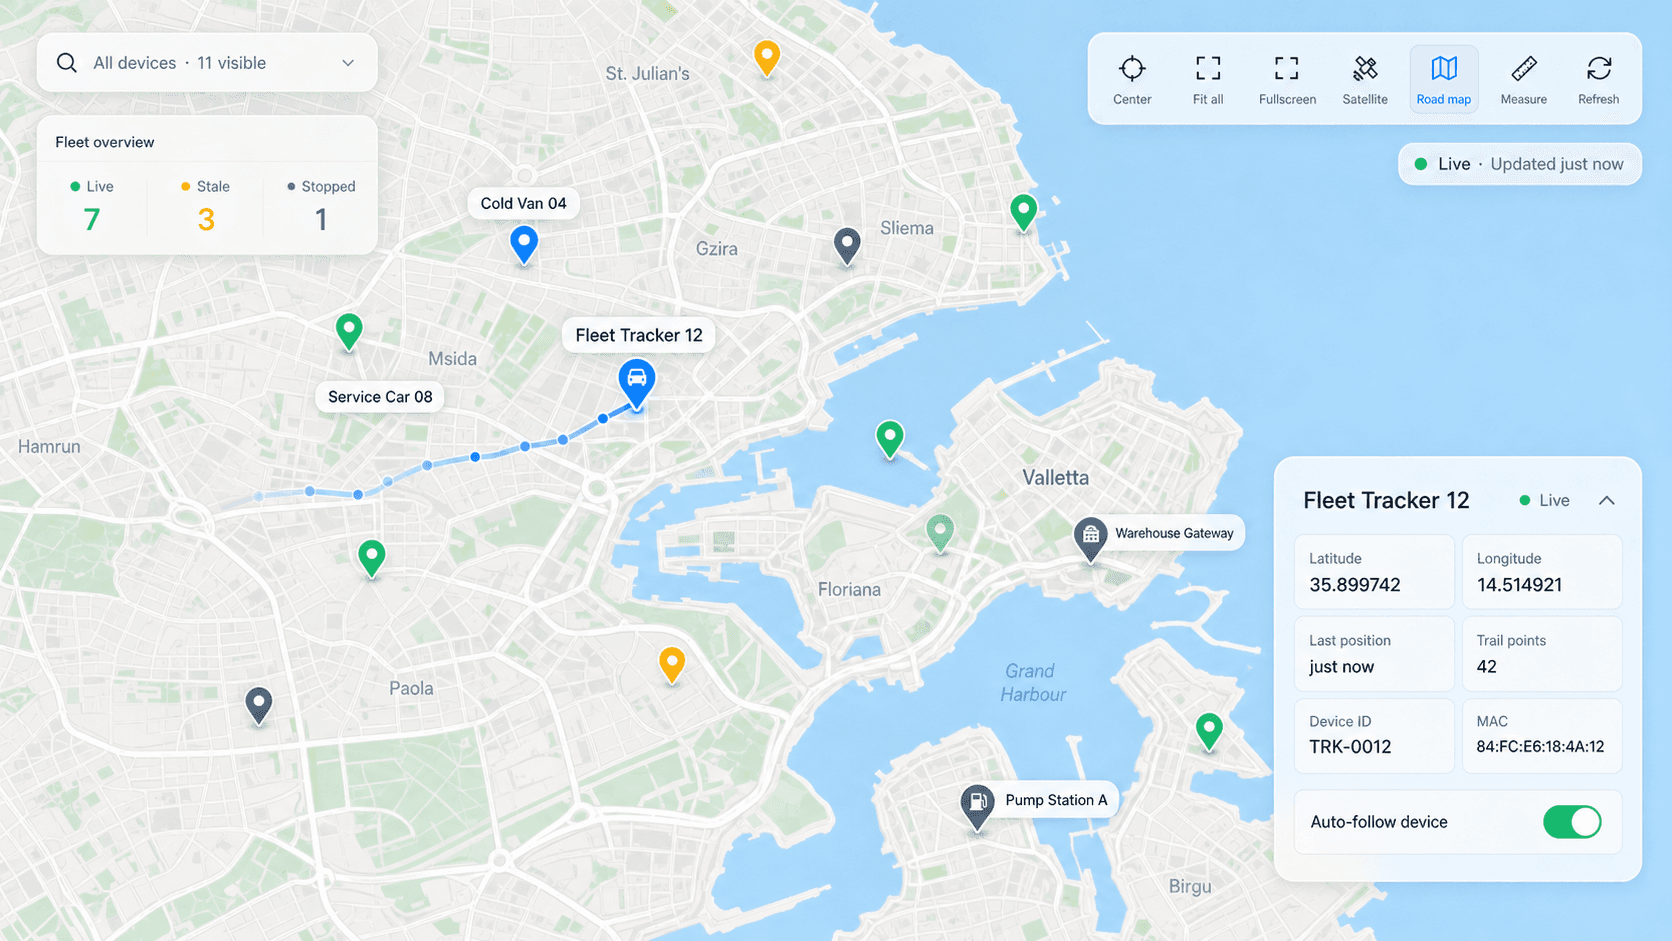
Start with every visible asset on one live map, then open a device to investigate its latest position and route history.
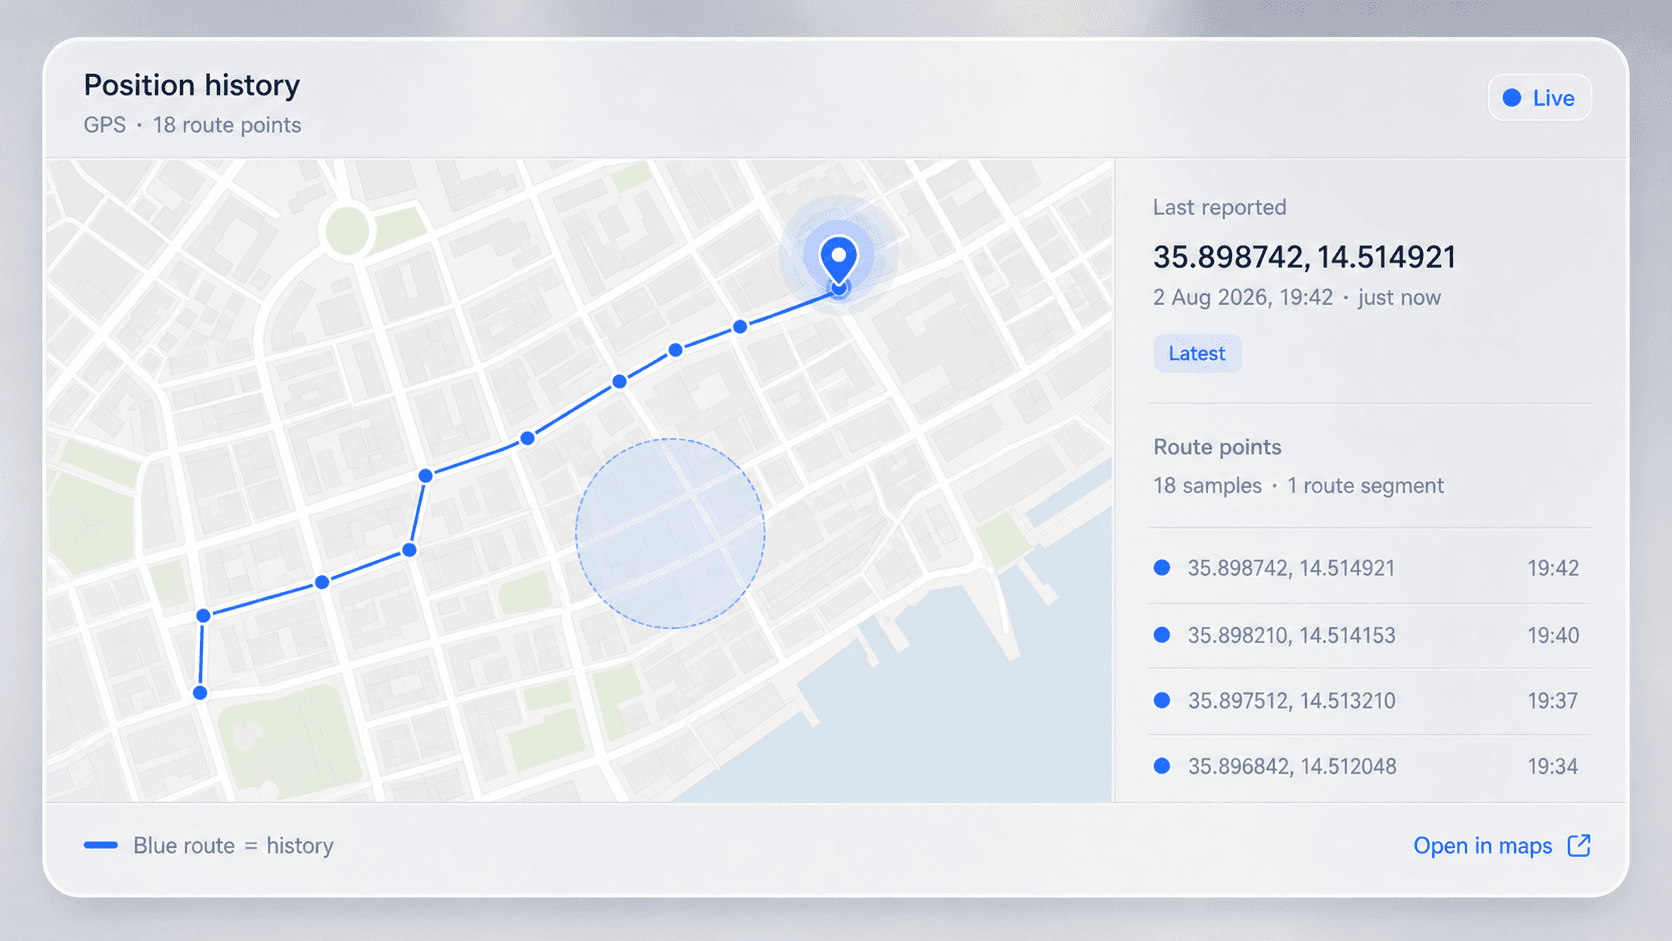
Review route points, timestamps, the latest report, and location boundaries without separating tracking from telemetry.
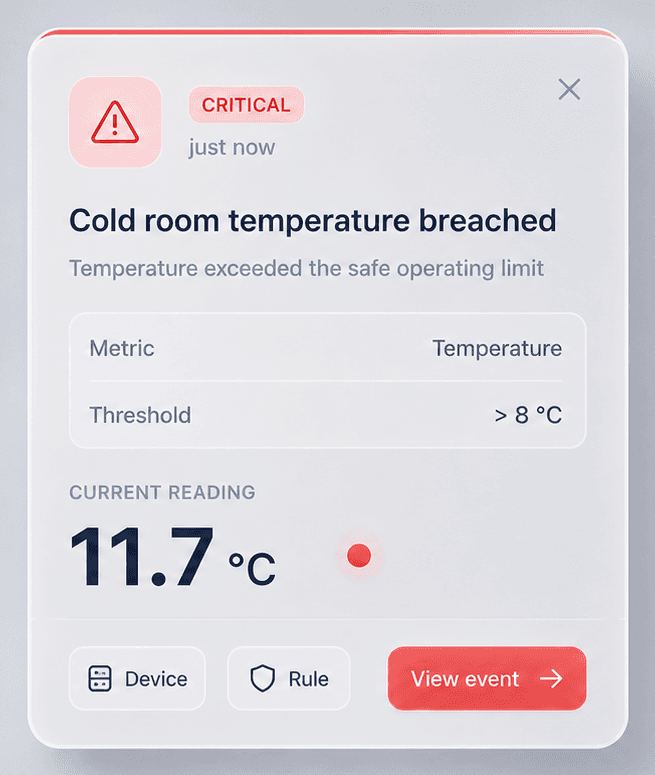
Teletra connects the current reading, threshold, device, and rule in one focused alert—so your team can act with context.
A connected operational layer for receiving, understanding, monitoring, tracking, and acting on device data.
Bring trackers, sensors, and gateways into one dependable data path.
Decode and calibrate incoming signals into clear, consistent readings.
Move between live activity and history without losing device context.
Create focused alerts for the operating conditions your team cares about.
Follow current positions, movement trails, and detailed route history.
Carry useful events and operational context into the tools around Teletra.
Bring your devices, insights, tracking, and alerts into one clear place.